Originally published at: http://tech.kinja.com/the-kinja-family-tree-1590442849
On a lark, I thought I’d use Kinja’s tag corpus to cluster blogs based on similarity. It may not be as exhaustive as comparing actual texts, but it is data that is readily available and can be collated relatively easily.
First, we’ll collate all of the tag counts by blog for every post created in May 2014. The end result is a set of 29,299 tags spanning 1,590 blogs. As in any text mining or machine learning operation, there is an amount of cleansing and transforming to be done before we can do anything useful with the data. No exception here. There’s bound to be some junk in there.
Here’s a histogram of the frequencies of tag counts over the entire collection:
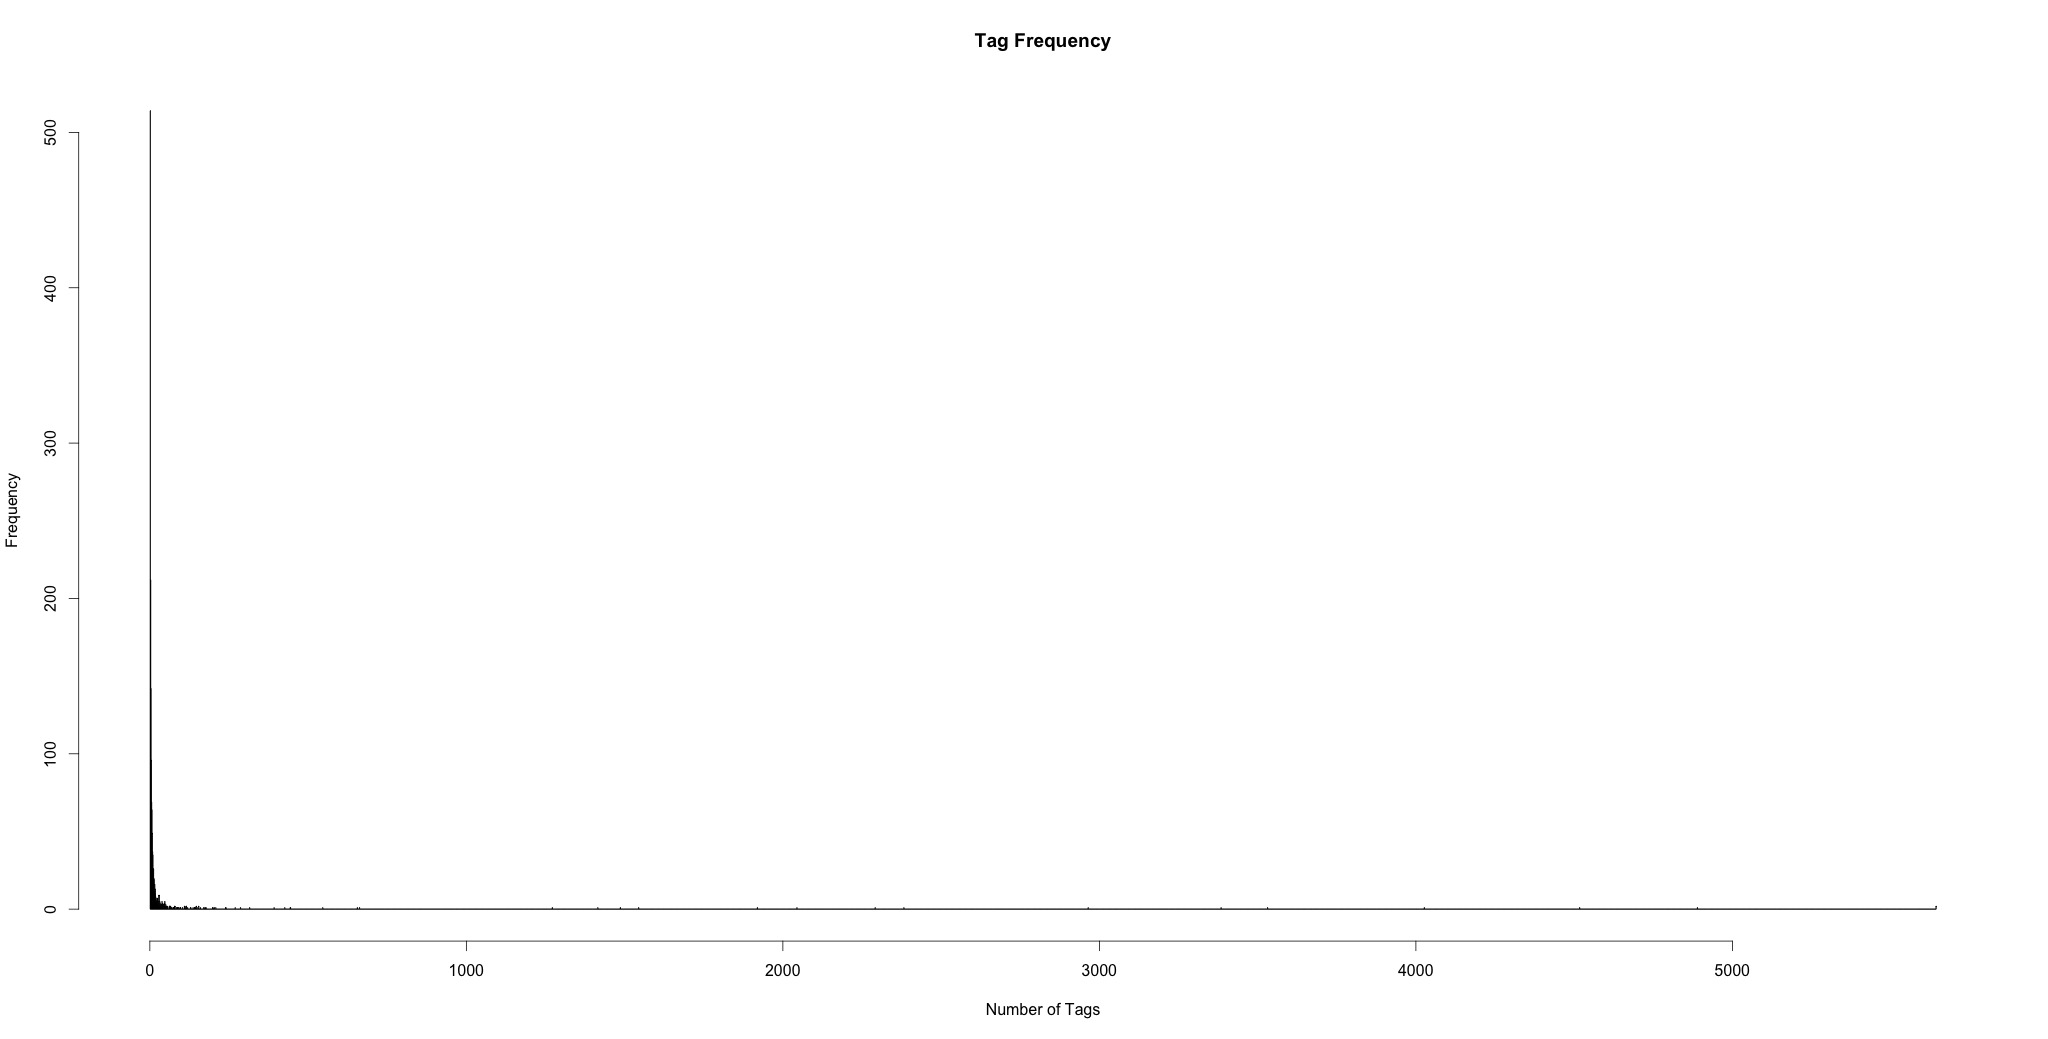
A bit difficult to see as most of the data is concentrated in the lower left portion of the graph. The single points along the horizontal axis are high-activity blogs like Gawker, Jezebel, etc. In this case, the max point represents i09 which has 5,644 tags.
If we zoom in to where most of the data is, we can get a better idea of how most of the data is distributed:
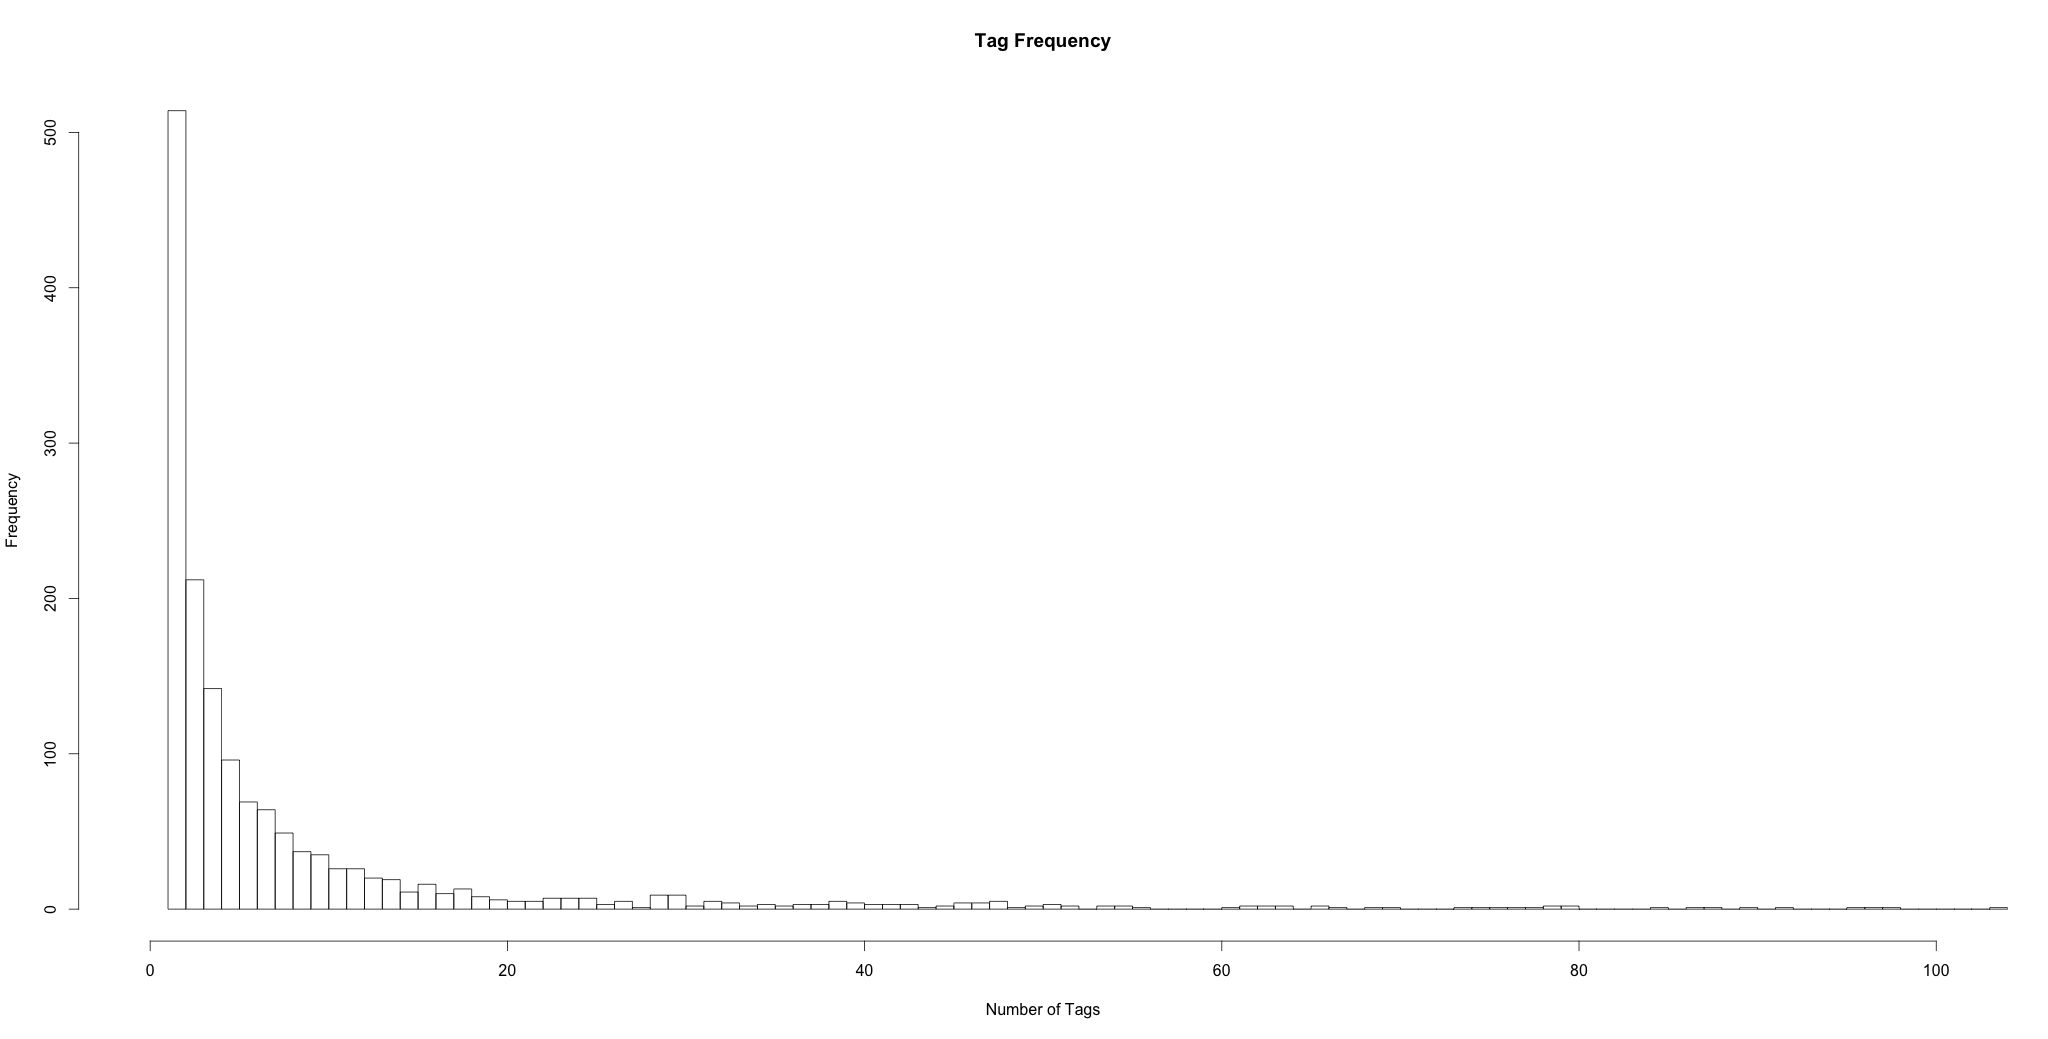
No surprises here. A classic longtail.
Twenty seems like a reasonable number of tags over 30 days to be active enough to have good data, and it also happens to be where the tail seems to level off. So we’ll purge all blogs with < 20 tags as well as any tags that were orphaned in the process. We’re left with 217 blogs containing 25,997 tags.
To make sense of all this…
We’re going to cluster the blogs in a hierarchical structure based on the similarity of the tags they contain. Each cluster will contain 2 elements - which can be either a blog, or another cluster. After computing the distance (or dissimilarity) table between each blog, the algorithm works as follows:
- Find the 2 items with the smallest distance between them.
- Place them in a cluster together
- Replace them in the distance table with the midpoint of the newly created cluster
- Repeat until all items are members of a cluster
This image illustrates the process step-by-step:
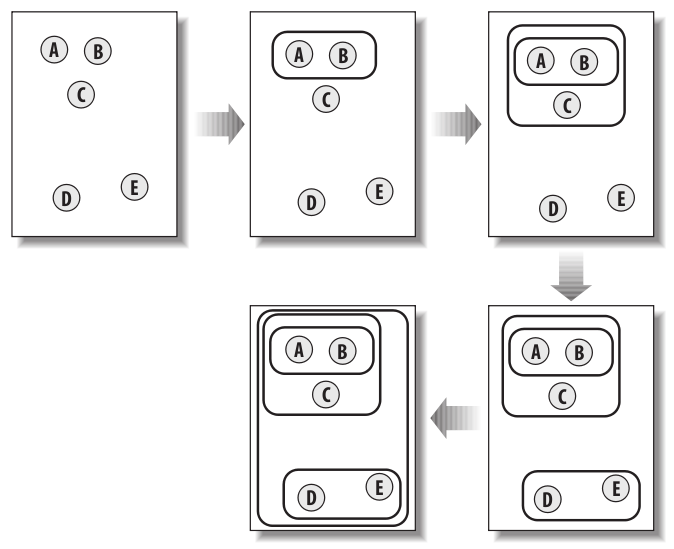
Image from: Programming Collective Intelligence
The term “distance” here can be interpreted quite literally. If you think of the data for every record as a point in space, you can use standard geometric spatial calculations to compare them. For example, if Gawker contained 3 occurrences of the tag “crackstarter” and 5 occurrences of “shut up brooklyn”, you’d plot it at the point (3,5). If Deadspin contained 2 and 6 of the same tags, respectively, it would sit at (2,6), and we could measure the distance between them as 1.4142. Of course, this dataset has 25,997 dimensions (one for each different tag) and is therefore difficult to visualize although the math is the same.
There are some deficiencies with this method, however. For one - it favors tags that appear frequently across the dataset (ie - many blogs may contain the tag “news” quite often, but that doesn’t necessarily mean they are similar). Fortunately there’s a well-known statistical method for normalizing this type of data called “Term Frequency - Inverse Document Frequency”, or Tf-Idf.
Let’s look at inverse document frequency. To find it, take the ratio of the number of documents (or blogs, since we are comparing those instead of individual documents) to the number containing a given term, and then scale it with the logarithmic function. After applying it to our list of tags, the results look like this:
| tag | idf |
|---|---|
| music | 2.012602 |
| video | 2.121801 |
| movies | 2.161022 |
| food | 2.244403 |
| tv | 2.244403 |
| politics | 2.288855 |
| 2.288855 | |
| art | 2.335375 |
| science | 2.335375 |
| star.wars | 2.384165 |
These are the most “generic” tags in the dataset, and therefore have the lowest idf values. In other words, the tag “music” has the least significance in calculating a blog’s position because it is so popular amongst all blogs. Now we multiply these with the raw count (term frequency) of each tag within the blogs and use that as our coordinates.
After computing the distance between each, they are clustered as explained above yielding this result:
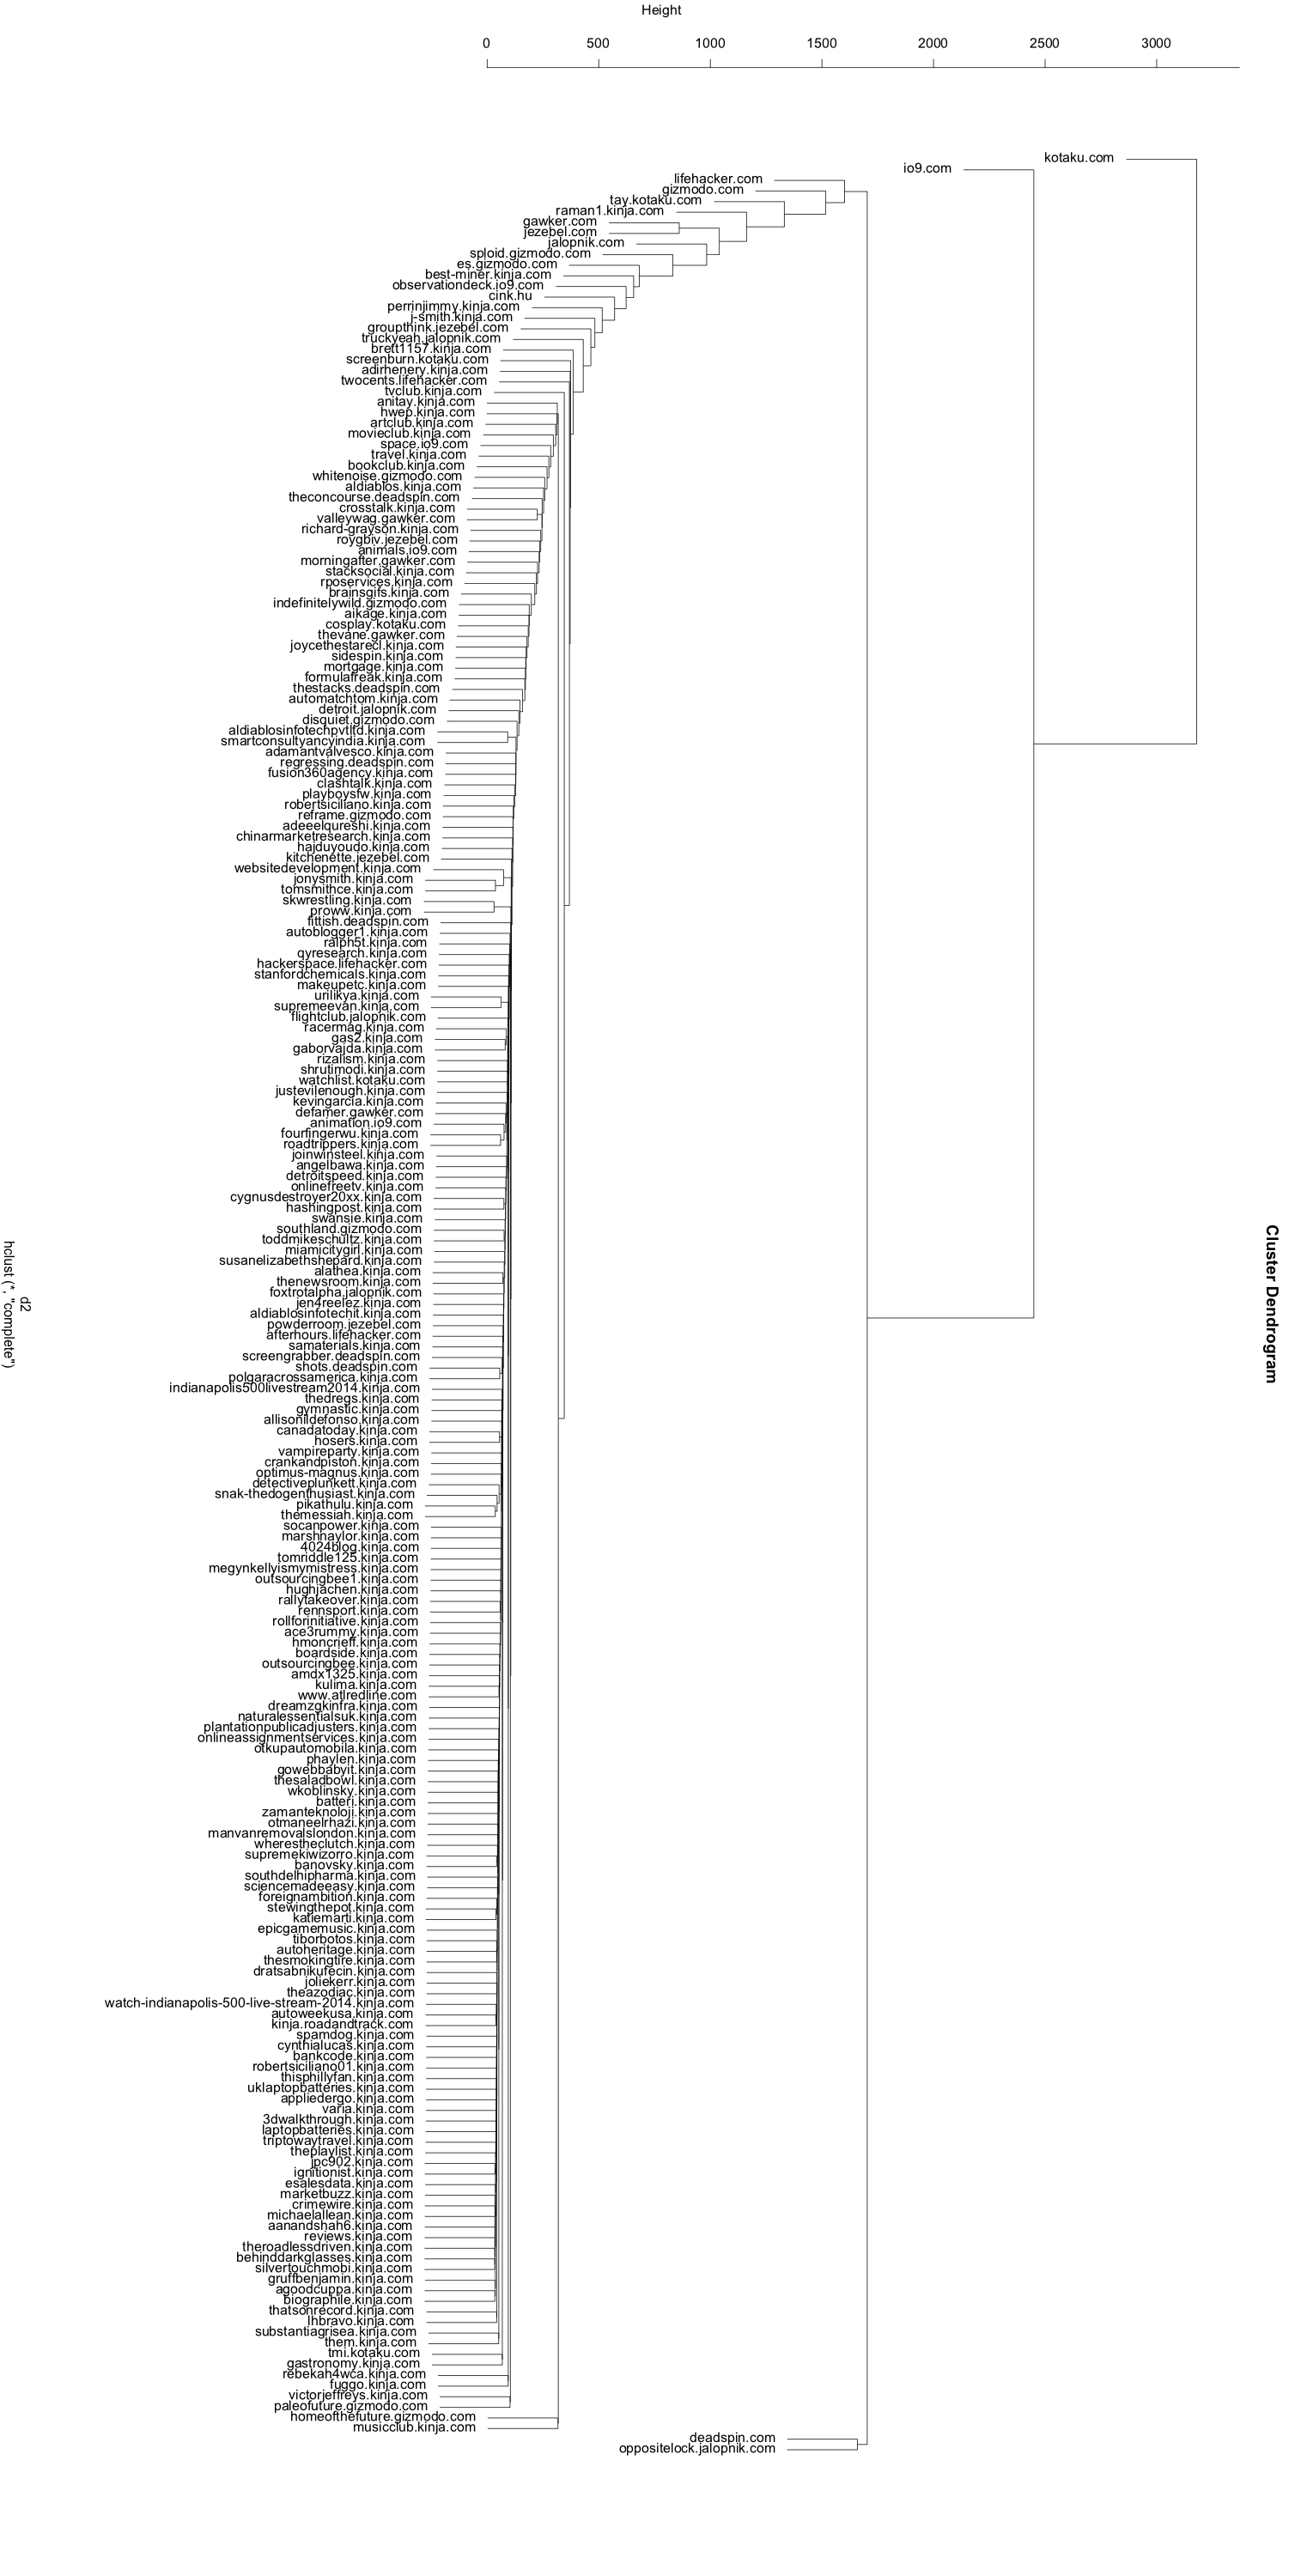
Looks lopsided. You’ll also notice that all of the Gawker Media blogs appear close to each other. We know that they each contain very different content so there must be something wrong with our calculations. This is the second problem with our methodology - we haven’t normalized for the size of each of the individual blogs. If, for example, there’s a small blog that sits at (3,5), it would be very far away from a blog at (300,500) - even though their tags are identical in proportion. Similarly, blogs with a small number of tags will appear close to each other because of the large number of tags they don’t have in common. This is simply the nature of Euclidean distance. Turns out there is a better distance metric for this type of problem.
Rather than treating each record as an individual point, we can think of them each as vectors with a direction and magnitude (linear algebra, ouch). Rather than calculating the Euclidean distance of their endpoints, we’ll instead compare the cosine of the angles between them (and now on to trigonometry, yikes). This is called cosine similarity and is a standard metric used in text mining applications. It specifically compares only the direction, or orientation, between two vectors while ignoring their magnitude. This means that blogs are compared equally regardless of the number of tags they have.
After calculating the cosine similarities and reclustering, the result is a much more uniform hierarchy:
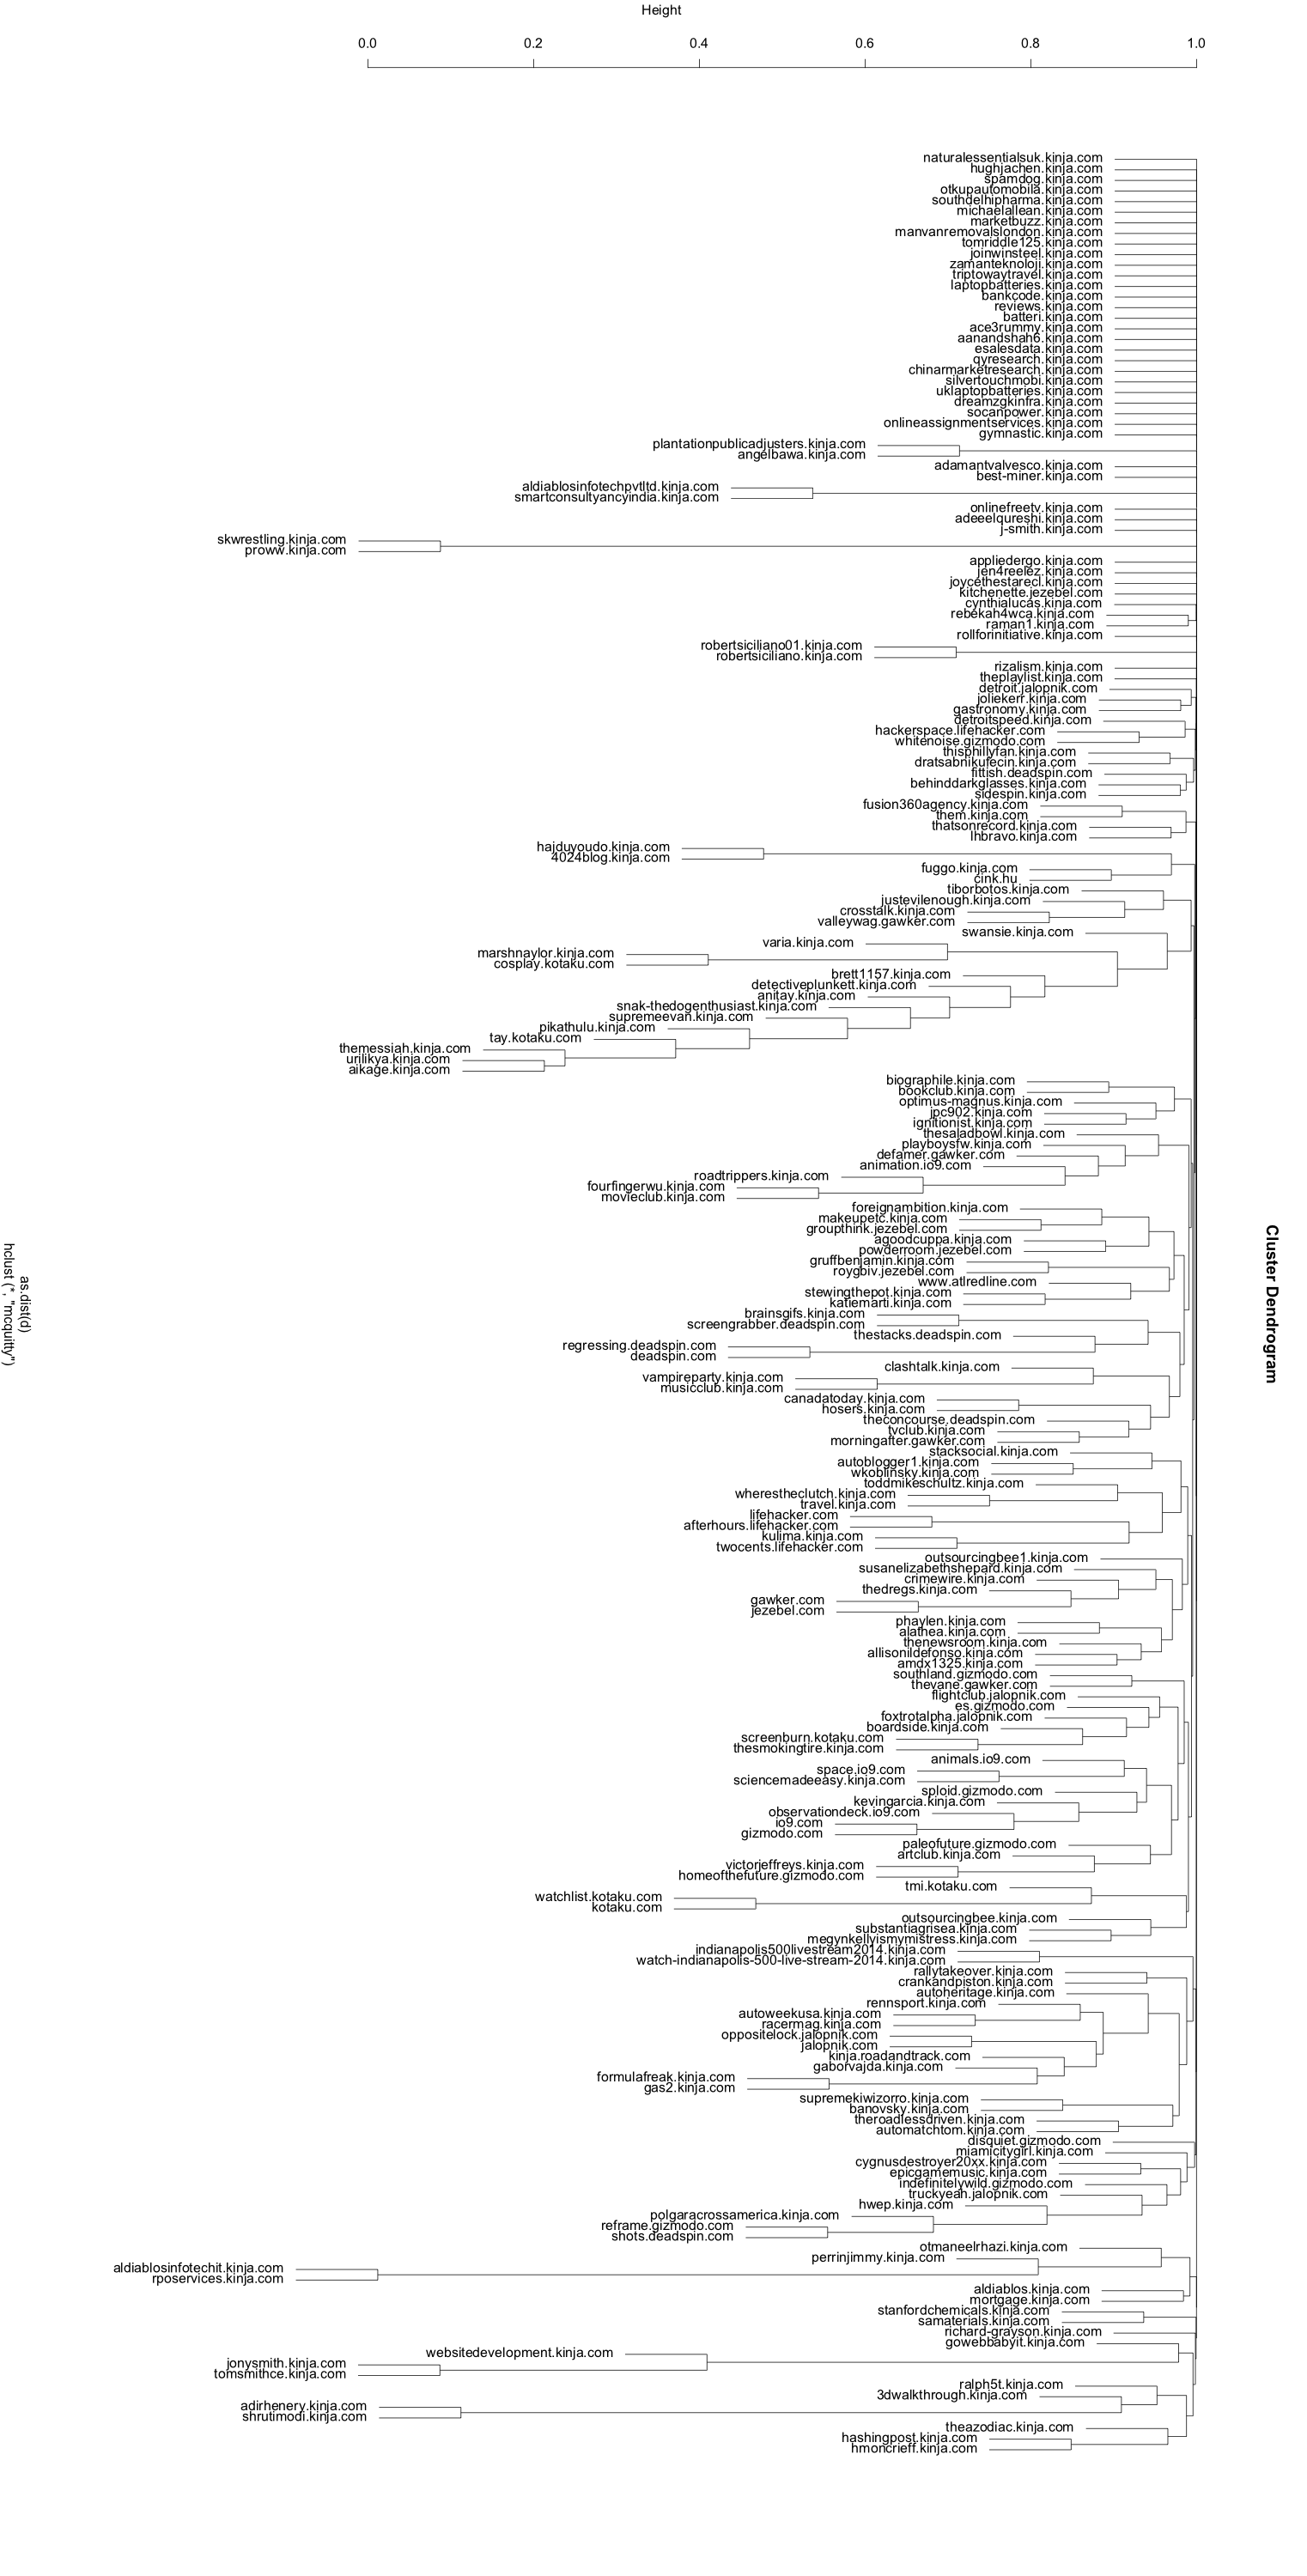
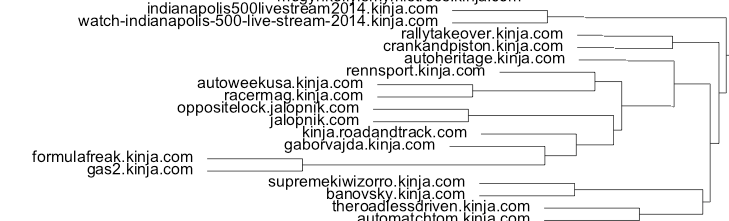
There are some pretty obvious clusters like this large one with a lot of automotive/racing content:
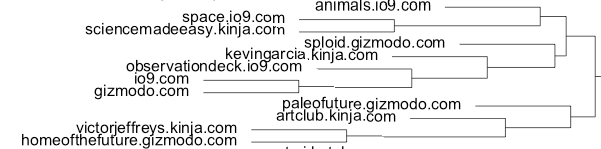
As well as this science/technology one:
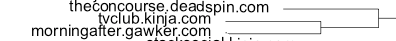
There are even some smaller clusters that show some interesting similarities, like these with a media/TV focus:
Of course, the quality of the clustering algorithm can only be as good as the data we feed it. In this case we are using subjective data - however an editor decides to tag her own articles will determine how they are clustered. Nonetheless, I feel it was an interesting experiment which really demonstrates the utility of clustering algorithms.